import numpy as np
import matplotlib.pyplot as plt
from iminuit import Minuit
from pprint import pprintBasic Least Squares Fit Example with Python (iminuit)
Heidelberg University Advanced Lab Course (F-Praktikum)

Fitting example using iminuit (https://iminuit.readthedocs.io). iminuit can be installed with pip install iminuit. Minuit is a robust numerical minimization program written by CERN physicist Fred James in 1970s. It is widely used in particle physics.
Read data from text file
xd, yd, yd_err = np.loadtxt("FP_basic_chi2_fit_data.txt", delimiter=",", unpack=True)Print data (as colums) to see what we read in:
for v in zip(xd, yd, yd_err):
    print(v)
(1.0, 1.7, 0.5)
(2.0, 2.3, 0.3)
(3.0, 3.5, 0.4)
(4.0, 3.3, 0.4)
(5.0, 4.3, 0.6)Define fit function
def f(x, a0, a1):
    return a0 + a1*x
Define \(\chi^2\) function
minuit finds the minimum of a multi-variate function. We need to define a \(\chi^2\) function which is then minimized by iminuit.
def chi2(a0, a1):
    fy = f(xd, a0, a1)
    diffs = (yd - fy) / yd_err
    return np.sum(diffs**2)
Initialize minuit and perform the fit
m = Minuit(chi2, a0=1, a1=0.5)
m.errordef = Minuit.LEAST_SQUARESm.migrad()| Migrad | ||||
|---|---|---|---|---|
| FCN = 2.296 | Nfcn = 32 | |||
| EDM = 1.13e-23 (Goal: 0.0002) | ||||
| Valid Minimum | No Parameters at limit | |||
| Below EDM threshold (goal x 10) | Below call limit | |||
| Covariance | Hesse ok | Accurate | Pos. def. | Not forced |
| Name | Value | Hesse Error | Minos Error- | Minos Error+ | Limit- | Limit+ | Fixed | |
|---|---|---|---|---|---|---|---|---|
| 0 | a0 | 1.2 | 0.5 | |||||
| 1 | a1 | 0.61 | 0.15 |
| a0 | a1 | |
|---|---|---|
| a0 | 0.211 | -0.0646 (-0.919) |
| a1 | -0.0646 (-0.919) | 0.0234 |
Print fit parameters:
for p in m.parameters:
    print(f"{p} = {m.values[p]:.2f} +/. {m.errors[p]:.2f}")
a0 = 1.16 +/. 0.46
a1 = 0.61 +/. 0.15Print covariance matrix:
print(m.covariance) ┌────┬─────────────────┐
│ │ a0 a1 │
├────┼─────────────────┤
│ a0 │ 0.211 -0.0646 │
│ a1 │ -0.0646 0.0234 │
└────┴─────────────────┘Plot data along with fit function
xf = np.linspace(1., 5., 1000)
a0 = m.values["a0"]
a1 = m.values["a1"]
yf = f(xf, a0, a1)plt.xlabel("x", fontsize=18)
plt.ylabel("y", fontsize=18)
plt.errorbar(xd, yd, yerr=yd_err, fmt="bo")
plt.plot(xf, yf, color="red")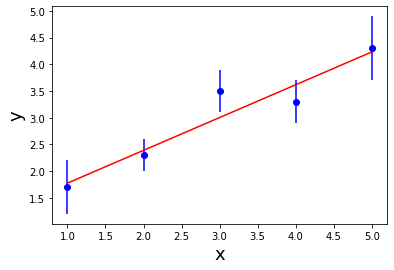
Calculate the \(\chi^2\) and \(p\)-value
chi2val = m.fval
n_data_points = xd.size
n_fit_parameters = 2
n_dof = n_data_points - n_fit_parameters

from scipy.stats import chi2
p_value = 1. - chi2.cdf(chi2val, n_dof)print(f"chi2/ndf = {chi2val/n_dof:.2f}, p-value = {p_value:.2f}")chi2/ndf = 0.77, p-value = 0.51