import numpy as np
import matplotlib.pyplot as plt
from scipy.optimize import curve_fitBasic Least Squares Fit Example with Python (curve_fit)
Heidelberg University Advanced Lab Course (F-Praktikum)

Fitting example using scipy’s curve_fit function. The curve_fit function is documented here.
Read data from text file
xd, yd, yd_err = np.loadtxt("FP_basic_chi2_fit_data.txt", delimiter=",", unpack=True)Print data (as colums) to see what we read in:
for v in zip(xd, yd, yd_err):
    print(v)
(1.0, 1.7, 0.5)
(2.0, 2.3, 0.3)
(3.0, 3.5, 0.4)
(4.0, 3.3, 0.4)
(5.0, 4.3, 0.6)Define fit function
This function is linear in the fit parameters. curve_fit can also handle fit functions which are not linear in the fit parameters.
def f(x, a0, a1):
    return a0 + a1*x
Perform the fit
Define reasonable start values for the fit parameters:
start_vals = (0.5, 1)popt, pcov = curve_fit(f, xd, yd, sigma=yd_err, p0=start_vals, absolute_sigma=True)Print fit parameters:
print(popt)[1.16206589 0.61394499]Also print the covariance matrix of the fit parametrs:
print(pcov)[[ 0.21118631 -0.06460345]
[-0.06460345 0.02341046]]Plot data along with fit function
xf = np.linspace(1., 5., 1000)
yf = f(xf, *popt)plt.xlabel("x", fontsize=18)
plt.ylabel("y", fontsize=18)
plt.errorbar(xd, yd, yerr=yd_err, fmt="bo")
plt.plot(xf, yf, color="red")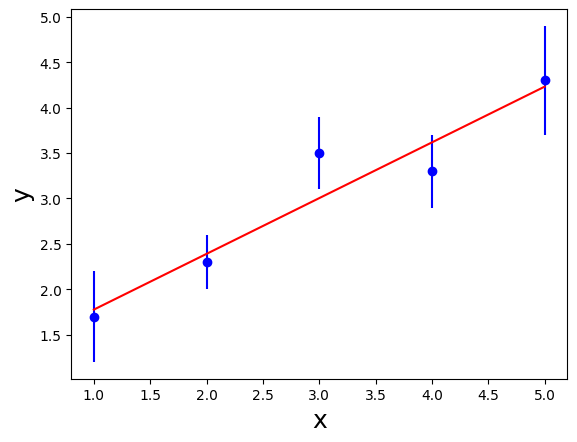
Calculate the \(\chi^2\) per degree of freedom
diffs = (yd - f(xd, *popt)) / yd_err
diffs_squared = diffs**2
chi2 = np.sum(diffs_squared)
n_data_points = xd.size
n_fit_parameters = 2
n_dof = n_data_points - n_fit_parametersprint("chi2/ndf = " + str(round(chi2,2)) + "/" + str(n_dof))chi2/ndf = 2.3/3